Pennsylvania
Economic Engine of Pennsylvania
Southeastern PA is the Commonwealth’s key economic engine. THE FIVE COUNTIES GENERATE 42% OF STATE’S ECONOMIC ACTIVITY WITH 32% OF ITS POPULATION ON 5% OF ITS LAND. This degree of economic productivity and density is not possible without transit to efficiently move people throughout the region.
36% of State Tax Revenue
With just 32% of the state’s population, SOUTHEASTERN PA GENERATES $13.3 BILLION (38%) OF THE TOTAL TAX REVENUES to the state general fund.

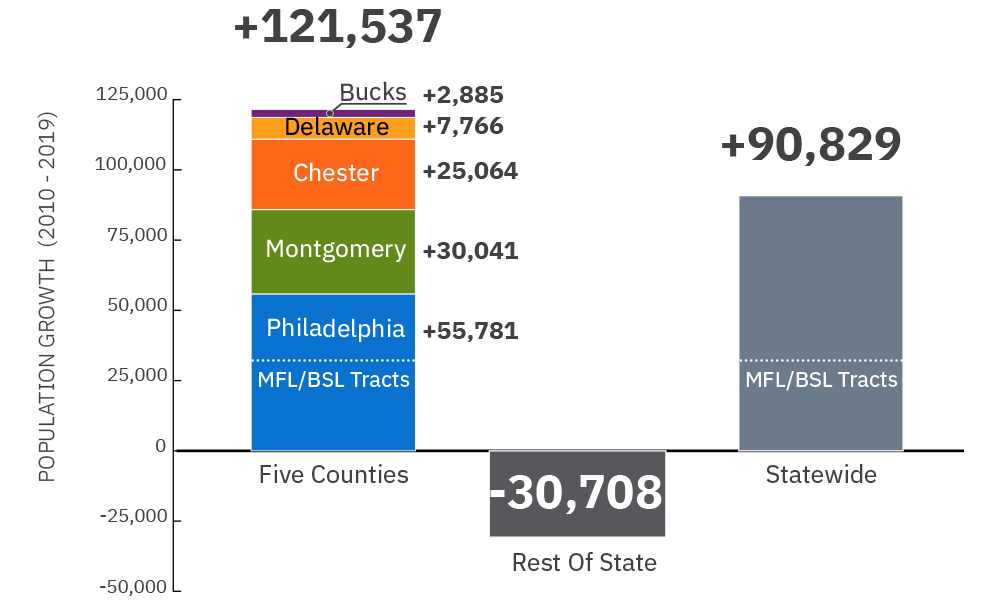
State Population Growth
Southeastern PA led the state’s POPULATION GROWTH between 2010 and 2019, one-third of which occurred along the Market-Frankford (MFL) and Broad Street (BSL) Lines.
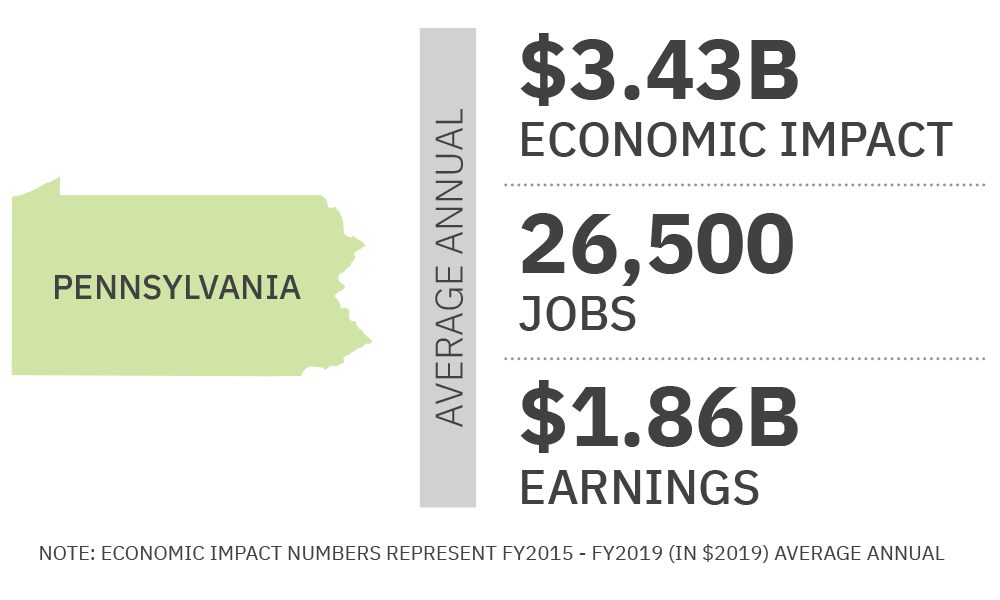
Overall Impact
In Fiscal Year 2019, SEPTA’s 2,800 trains, buses, trolleys and paratransit vehicles provided 1.0 million trips across the region to work, school, appointments and entertainment. This transit service is the lifeblood of the regional economy. As one of the area’s largest employers, SEPTA also supports the economy as a jobs provider and purchaser of goods and services to keep the system running.
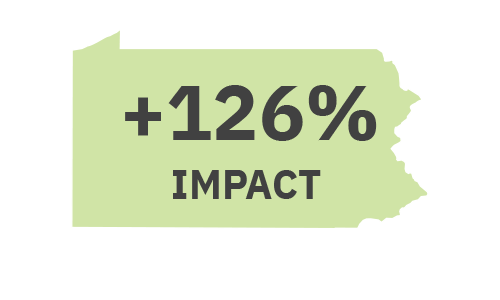
Act 89 – Capital Impact
When the PA State Legislature passed Act 89, SEPTA was ready to efficiently invest the new capital dollars in long-needed maintenance, state of good repair capital refurbishments, and replacement of vehicles. SEPTA is now six years into a 20-year capital program. The program addresses this backlog and creates the opportunity to consider much needed expansion to meet the needs of a growing region.


Note: CAPITAL impact numbers represent FY2015 – FY2019 (IN $2019) AVERAGE ANNUAL
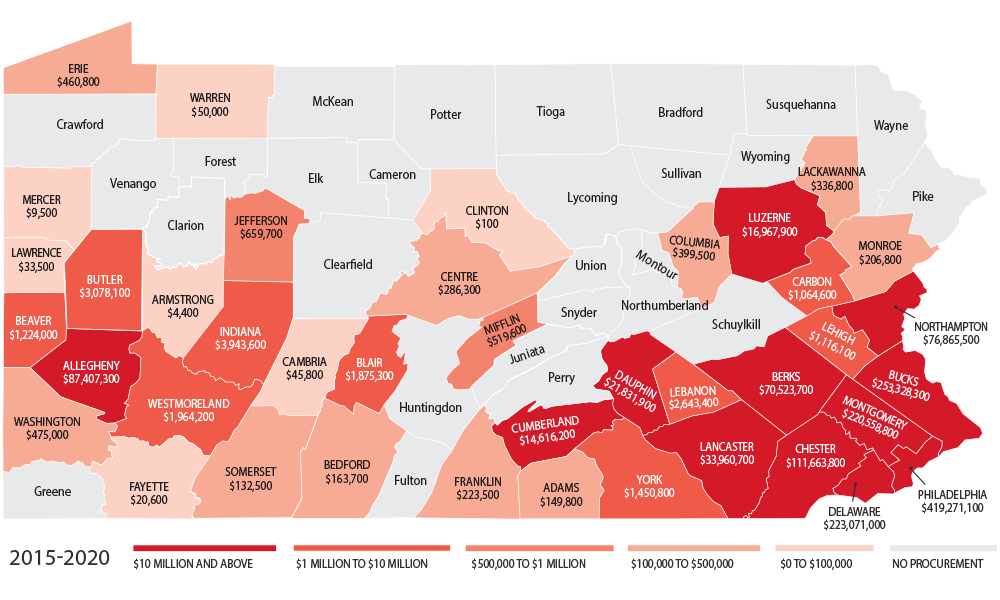
Procurement Map
With funding from Act 89, SEPTA continues to invest in Pennsylvania businesses. Over the past six years (2015 – 2020), SEPTA has issued a total of $1.57B IN CONTRACTS to PA companies, an average annual value of $261M PER YEAR.